A New Metric for Quantifying Machine Learning Fairness in Healthcare
In the context of healthcare, the standard of disparate impact is entirely inappropriate. We propose a new method for measuring fairness called Group Benefit Equality, which aims to measure the rate at which a particular event is predicted to occur within a subgroup compared to the rate at which it actually occurs.
Written by Joseph Gartner, Director of Data Science, ClosedLoop
Originally published March 2, 2020. Last updated June 19, 2023. • 12 min read
Background
Several recent, high profile cases of unfair AI algorithms have highlighted the vital need to address bias early in the development of any AI system. For the most part, bias does not come into algorithms due to malicious intent by the individual creating the algorithm. Bias comes from a lack of diligence in ensuring that the AI system is fair for everyone. In order to combat bias, it must be measured in a way that is relevant for the context of the problem. Within healthcare, the ‘gold standard’ for bias detection is not appropriate. Because of this, ClosedLoop has developed a new metric for measuring bias within healthcare.
Recently, there has been a great deal of effort to measure and combat algorithmic bias. In their 2018 paper[1], Verma and Rubin present a rich selection of fairness metrics, as well as defining the basic statistical measures that all fairness measures use. Each of these metrics has strengths and weaknesses, and the context in which the algorithm is deployed dictates which metrics are appropriate. Often, the approach to fairness draws upon the legal standard of disparate impact[2][3]. Disparate impact occurs when the predicted outcomes are different for different groups. Some examples of when this metric is used are recidivism[4], hiring[5][6], and loan applications[2]. This standard metric accounts for only one factor: the rate at which the algorithm predicts a person should benefit from a particular classification.
In the context of healthcare, the standard of disparate impact is entirely inappropriate. The above examples have a common characteristic; every individual the algorithm applies to would benefit from a positive label. People don’t apply for parole, a job, or a loan if they don’t care about the outcome. In healthcare, and particularly population health, predictions are used to allocate resources, but the benefit can vary for different groups. Only those individuals that will suffer from a particular outcome benefit from the intervention from the model. In most cases prevalence of particular outcomes has significant variance across gender, racial, and socioeconomic groupings.
Obvious examples are breast cancer, with less than 1% of cases occurring in men[7], or sickle cell disease disproportionately impacting black Americans[8]. Less obvious cases are fall injuries, with a higher prevalence among females[9], or suicide rates, with high fluctuation across gender and racial lines[10]. For many other diseases, more subtle differences occur but with variations that are still statistically significant. A common sense notion of fairness certainly wouldn’t expect an even number of males and females to be identified as having high risk for breast cancer, but this is exactly what metrics based on disparateimpact optimize for. Consequently, ClosedLoop has developed a new metric for quantifying fairness that is uniquely suited to healthcare.
Group Benefit Equality
We propose a new method for measuring fairness called “Group Benefit Equality.” Group benefit equality aims to measure the rate at which a particular event is predicted to occur within a subgroup compared to the rate at which it actually occurs. Suppose there is a predictor with predicted labels y‘, and true outcomes y. A group benefits from the algorithm by having the attention of providers afforded to those individuals in the case that they have a positive prediction (y‘=1). A predictor is considered to have perfect group benefit equality in the case that:
P(y‘=1 | C=c) = P(y=1 | C=c) for all c in C
Here, c is a subgroup of the partitioning variable C, and C can be any partition that should be examined for protection, including race, gender, age, Medicaid status (a proxy for income), and disability status. Group benefit equality can be transformed as the ratio P(y‘=1 | C=c)/P(y=1 | C=c). In terms of standard accuracy measures, Group Benefit Equality is (tp + fp)/(tp+fn), where tp are the number of True Positives, fp is the number of False Positives, and fn are the number of False Negatives.If this ratio fluctuates low, it means that the subgroup is being flagged for intervention at a lower rate than the prevalence of the event within the subgroup. If this number is sufficiently lower than 1.0, that means that the model has the potential to harm this subgroup by denying them resources. As a result, steps should be taken to either reduce this bias or account for it in the allocation of resources. If this ratio fluctuates high, it means that resources are being allocated to this group at higher rates than the group needs. As long as it does not cause the first type of fluctuation in another group, this type of fluctuation is acceptable. The threshold of 0.8 for flagging a group as potentially biased is used, which comes from the legal standard for disparate impact.
Figure 1 – Group benefit equality for a model predicting severe fall related injuries in Medicare recipients, partitioned by gender.
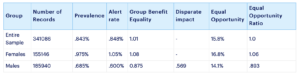
To see how this metric is used, we evaluate its application in a model built to predict Severe Fall-Related Injuries within the next 30 days for medicare patients. Figure 1 depicts group benefit equality for a model that predicts severe fall related injuries. The prevalence in a sample of 2010 medicare records is observed to be .843% for the entire sample. If we partition by gender, we observe .975% in females and .686% in males. For the purpose of consistency, a threshold is selected such that group benefit equality is very nearly 1.0 for the entire sample, (in this case, a decision threshold of p>=.071 results in a group benefit equality of 1.005). This threshold means that the model would flag roughly the same number of individuals as being at risk as the observed occurrence of injury. Table 1 summarizes performance and fairness for this threshold. Note that the prevalence within the female sub-population is roughly 1.5 the rate observed in men. One can see that the model predictions reflect this inequality. The value for disparate impact is .569, well below the standard threshold of .8; this would mean that by this standard this model is biased against males. If instead, group benefit equality is calculated, the score of .875 is observed. While there is room for improvement in servicing this sub-population, one would not classify this model as biased against men.
Table 1 – Severe Fall Related Injury Measures of Fairness
Group Benefit Equality is calculated independently from class to class. Disparate Impact is calculated with respect to a base class, in this case we calculate the disparate impact on males compared to the female base class.
Comparison to Existing Metrics
Group Benefit Equality is similar to an existing measure “Equality of Opportunity”. Equality of Opportunity occurs when the sensitivity for the two groups are the same (tp/(tp+fn)). Our metric differs by this mathematically by the presence of the false positive term in the numerator. If such a similar term exists, why would one elect to report fairness using a different metric? The strength of group benefit equality is its transparency and ease of explanation. One huge strength of group benefit equality is having a default objective for tuning the decision threshold. Even if most providers elect to operate at slightly higher alarm rates than the prevalence for an event, we set the threshold so that benefit equality is 1.0 for the population. For equal opportunity, no such guideline is defined. Not having a default level for equality of opportunity presents an opportunity for practitioners to vary their decision threshold to levels that makes their model fairness look better.
Group benefit equality also benefits from being a more intuitive explanation of fairness. This metric directly measures the alerts raised for a group versus their rate of occurrence. While one can look at the equal opportunity for all subgroups, there is no clear threshold for what constitutes unacceptable bias. The analogy would be the difference between a Pearson correlation or a residual sum of squared errors in regression. While both quantify the models performance, the former is significantly easier to understand and explain; unsurprisingly, it is the metric most individuals use to describe a regression model. In order to achieve this effect, many fairness metrics are presented as the quotient of a protected subgroup to a base subgroup[2]. As the goal of healthcare is to deliver interventions to those individuals who need it, choosing reference subgroups means that models will make fairness evaluations blind to instances where the base class has an alarm rate that is too low. In most cases, males are the base class for gender, so using that approach, fairness evaluations would be completely blind to potential shortcomings for that subgroup.
Figure 2 – Group benefit equality for a model predicting severe fall related injuries in Medicare recipients, partitioned by Age.
A final strength of this model is an intrinsically economic view of alerts. Figure 1 depicts group benefit equality for several age groups within the data set. Looking at this figure, one can see that there is a score that is quite low for those individuals who are within the 65-74 year range. The model was built on medicare billing data, so this cohort actually represents the largest group within the data. Looking at the distribution, the fact that the lower prediction rate within this subgroup is directly caused by elevated prediction rates within the 18-64 and 85-100 groups. Due to the fact this model comes from Medicare data, the individuals in the 18-64 year range are typically disabled with serious medical complications. The other group, 85-100, is simply the oldest and most naturally susceptible group to these types of injuries. In this way, the explanation that being biased to predicting our most at risk groups at too high a rate makes the lower predictions within the bulk of our population more understandable.
Case Study
In an effort to combat COVID-19, ClosedLoop built an open sourced tool for quantifying vulnerability to severe complications due to a COVID-19 infection, called the CV19 Index. COVID-19 is known to have elevated mortality rates in older individuals. ClosedLoop built multiple instances of the CV19 Index. One model was trained on the Medicare population, and one on a Medicaid Population. These two populations have very distinct dynamics, so looking at fairness across lines of age is a natural breakdown for this measure. The first instance of the model was trained on a 5% sample of the Medicare population. Group Benefit Equality on this population is shown in Figure 3. Interestingly, at a 3% alert rate on a blended population, this model under-predicts for the group that is young. To understand this, it’s important to remember the Medicare is primarily individuals who are above the age of 65. Medicare does allow individuals who are below this age to be included, but these individuals have serious medical conditions. A consequence is that when this model is applied to the general population, it overestimates younger individuals health vulnerability.
Figure 3 – Group Benefit Equality for a COVID-19 model built on Medicare data.
Similarly, we can examine the performance of the model trained on Medicaid data on the general population, depicted in Figure 4. Interestingly, the exact opposite groups are triggered at lower levels. The exact opposite dynamic is at play. Individuals who are above 65 are typically on Medicare, not Medicaid. However, some individuals with serious medical needs are dual eligible. The consequence is quite clear, and an illustrative example of why applying models to the same populations are very important.
Figure 4 – Group Benefit Equality measured on a general population for a model trained on Medicaid data.
In order to have a model that performed on the general population, we created a blended model, depicted in Figure 5. The models were blended by switching from the Medicaid to Medicare model once an individual turns 65, and scaling the Medicaid predictions. Here, we observe generally good performance across most age groups. For the youngest population subgroups, this is fairly intuitive. Most young people will not have serious complications from COVID-19, and in cases when they do, the data supports the notion that it is less predictable. As further information emerges surrounding younger individuals experiencing such complications, it is a high priority to incorporate into these models.
Figure 5 – Group Benefit Equality measured on a general population for an ensemble of models coming from Medicare and Medicaid data.
Conclusions
No single metric is a silver bullet against algorithmic bias. Practitioners should calculate several bias metrics, like group benefit equality and equality of opportunity in conjunction and think critically about the impacts of any difference that may be observed. With that said, it is helpful to have a single metric that is easy to explain, benefits from a transparent procedure, and has well defined target value and thresholds for when a model is potentially biased. Group benefit equality uniquely satisfies all of these requirements, and is the best metric in healthcare for quantifying algorithmic fairness.
References
[1] Verma, Sahil, and Julia Rubin. “Fairness definitions explained.” 2018 IEEE/ACM International Workshop on Software Fairness (FairWare). IEEE, 2018.
[2] IBM Cloud. “Fairness Metrics Overview”. https://cloud.ibm.com/docs/ai-openscale?topic=ai-openscale-anlz_metrics_fairness
[3] Feldman, Michael, et al. “Certifying and removing disparate impact.” proceedings of the 21th ACM SIGKDD international conference on knowledge discovery and data mining. 2015.
[4] Chouldechova, Alexandra. “Fair prediction with disparate impact: A study of bias in recidivism prediction instruments.” Big data 5.2 (2017): 153-163.
[5] Dastin, Jeffery. “Amazon Scraps Secret AI Recruiting Tool That Showed Bias Against Women”. https://www.reuters.com/article/us-amazon-com-jobs-automation-insight/amazon-scraps-secret-ai-recruiting-tool-that-showed-bias-against-women-idUSKCN1MK08G
[6] Ajunwa, Ifeoma, et al. “Hiring by algorithm: predicting and preventing disparate impact.” Available at SSRN (2016).
[7] Anderson, William F., et al. “Male breast cancer: a population-based comparison with female breast cancer.” Journal of Clinical Oncology 28.2 (2010): 232.
[8] Centers for Disease Control and Prevention. “Data & Statistics on Sickle Cell Disease”. https://www.cdc.gov/ncbddd/sicklecell/data.html
[9] Stevens, Judy A., and Ellen D. Sogolow. “Gender differences for non-fatal unintentional fall related injuries among older adults.” Injury prevention 11.2 (2005): 115-119.
[10] Curtin, Sally C., and Warner, Margaret. “Suicide Rates for Females and Males by Race and Ethnicity: United States, 1999 and 2014”. National Center for Health Statistics. https://www.cdc.gov/nchs/data/hestat/suicide/rates_1999_2014.htm
Interested in reading more about bias and fairness in healthcare data science? Check out these blog posts:
Artificial intelligence (AI) and machine learning (ML) are increasingly used in healthcare to combat unsustainable spending and produce better outcome...
COVID-19 simultaneously exacerbated existing health disparities and introduced entirely new ones. The pandemic disproportionately impacted people of c...
11 min read
Make AI/ML a core element of your care strategy.
Get in touch today to see the ClosedLoop platform in action.